DigiData Insights – Data Analytics Dashboard
Project Overview
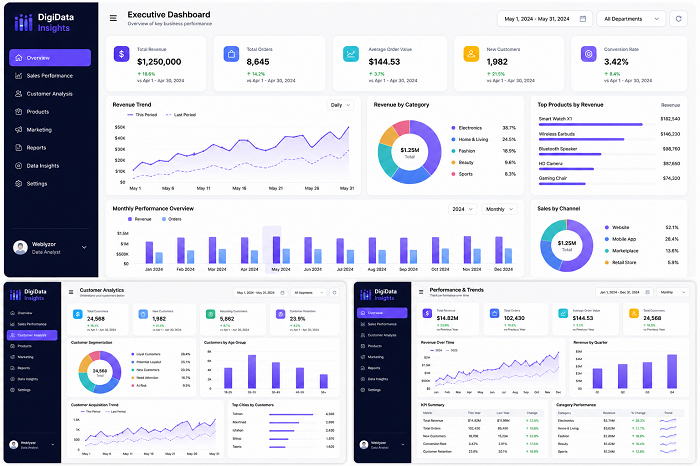
The dashboard provides a comprehensive overview of key metrics such as revenue, customer growth, sales performance, and conversion rates. It is designed to support decision-making by presenting complex data in a simple and intuitive format.
Key Features
- Revenue, orders, and performance tracking
- Customer segmentation and behavior analysis
- Monthly and yearly comparison reports
- Clean and modern UI/UX design
- Data transformation using Power Query
- Interactive charts and visual storytelling
- Structured and scalable data model
Challenge
Additionally, due to confidentiality constraints, real client data could not be used. Therefore, a realistic dataset was created to simulate real-world business scenarios while maintaining privacy.
Solution
The dashboard was built with a focus on clarity, usability, and performance. Each section was designed to answer specific business questions, enabling users to quickly understand trends, identify opportunities, and monitor performance.
Result
This project reflects Weblyzor’s ability to deliver data-driven solutions that support strategic decision-making while maintaining high standards of design and usability.
 Web Design
 Data Analytics
 Business Intelligence (Power BI)