
EDBI – Power BI Dashboard Project

Project Overview
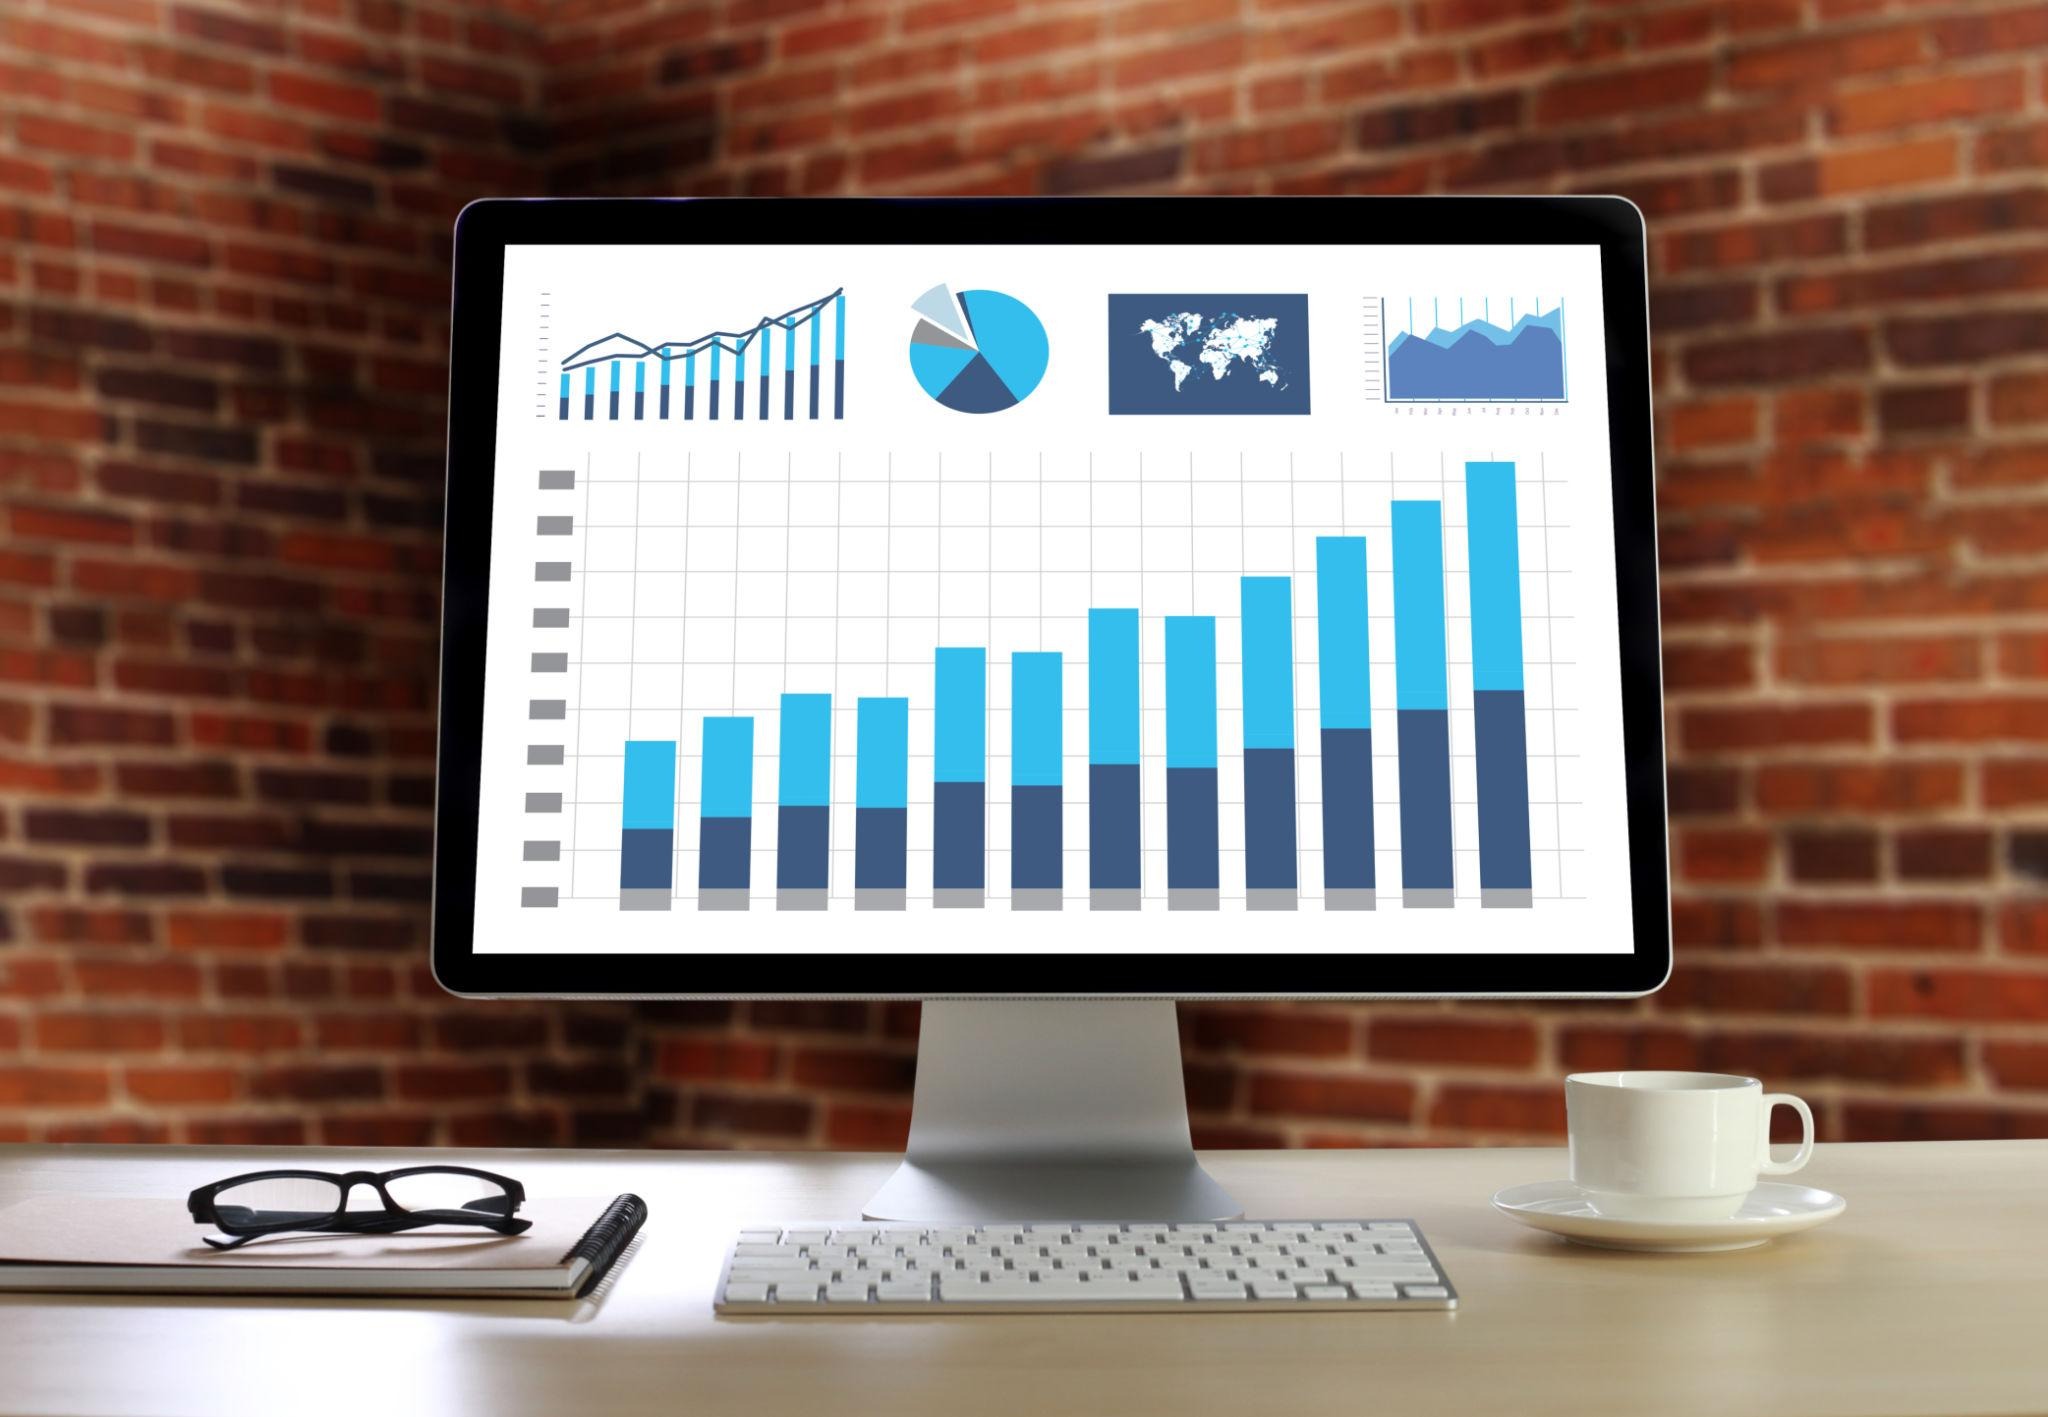
The dashboard provides a comprehensive overview of business performance, including revenue tracking, sales trends, customer insights, and KPI monitoring. It is designed for decision-makers who require fast, accurate, and visually clear reports.
Key Features
- Advanced KPI monitoring system
- Sales and revenue performance tracking
- Customer insights and segmentation
- Dynamic filtering and drill-down analysis
- Clean and professional UI design
- Real-time data interpretation structure
- Scalable data model for future expansion
Challenge
Additionally, due to data confidentiality, real datasets could not be used. Therefore, a realistic and structured dataset was designed to simulate real business environments.
Solution
Using DAX and Power BI capabilities, the dashboard enables users to filter, analyze, and explore data efficiently. The design focuses on usability, clarity, and business impact.
Result
This project demonstrates Weblyzor’s capability to deliver scalable and intelligent data solutions that support strategic decision-making and business growth.
 Web Design
 Data Analytics
 Business Intelligence (Power BI)